MAPE in Supply Chain: How to Measure and Improve Your Forecast Accuracy
- Updated
- 3 February 2026
- Reading time
- 5 min read

MAPE (Mean Absolute Percentage Error) is one of the most widely used metrics in demand planning. It measures how much a forecast deviates on average from the actual demand, helping to assess accuracy across products, channels, or regions.
In this article, we explain what MAPE is, how to calculate it, its limitations, and how to reduce it. A practical guide to using this metric wisely and improving decision-making in procurement, supply, and production. Because measuring accurately is the first step towards better planning.
What is MAPE and How Is It Used in Demand Planning?
MAPE measures the average percentage error between actual demand and the forecast. In simple terms, it tells you how far off, on average, your forecast is from reality. Its key advantage is its straightforward interpretation: a MAPE of 15% means that the forecast, on average, deviates by 15% from actual demand.
It is widely used in Sales & Operations Planning (S&OP), and in the planning of procurement, supply, and production. As a percentage metric, it allows performance comparisons across product families, channels, and regions. In sectors like FMCG, pharma, manufacturing, and retail, MAPE is one of the go-to indicators for demand planners.
How Is MAPE Calculated? Formula and Practical Example
The MAPE formula is:

Where:
• D is actual demand.
• F is the forecast.
• n is the number of periods or items.
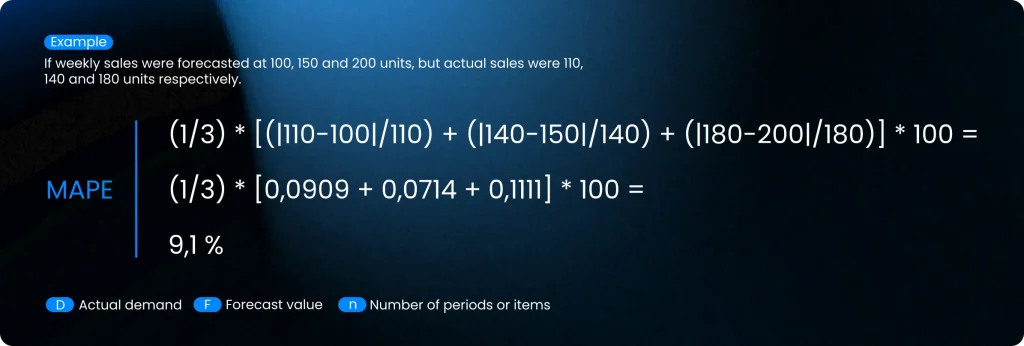
Practical example of MAPE calculation
If forecasted sales for three weeks were 100, 150, and 200 units, and actual sales were 110, 140, and 180 respectively, MAPE is:
What Is an Acceptable MAPE? Industry Benchmarks
There is no universal “good” or “bad” MAPE threshold, it depends on your business context, demand variability, and forecasting maturity. However, indicative benchmarks are:
• FMCG: 15% to 25% is acceptable.
• Manufacturing: 20% to 40%.
• Pharma: 10% to 20% in stable demand environments.
• Fashion retail: over 30% due to seasonality and short life cycles.
A MAPE under 10% is typically considered excellent but is only achievable in highly predictable or controlled settings. What matters most is tracking its trend, identifying large deviations, and analysing root causes.
MAPE Limitations: When It Can Be Misleading
Despite its popularity, MAPE has its flaws. One major issue is its sensitivity to low demand. When actual demand is near zero, percentage errors skyrocket, distorting the average.
MAPE also penalises over- and under-forecasting equally, despite these often having different financial impacts. For instance, overstocking a low-cost item may not hurt as much as understocking a high-value or critical item.
Another drawback: MAPE doesn’t show which SKUs account for most of the error. Two catalogues with the same overall MAPE may differ greatly, one with evenly spread errors, the other with a few SKUs skewing the average.
How to Reduce MAPE in Complex Environments
Reducing MAPE isn’t only about choosing the right algorithm. Other factors, such as the nature of the demand, the presence of outliers, and cross-functional collaboration, can be just as important. Here are three key approaches to improve forecast accuracy in high-variability environments:
Intermittent Series
Intermittent demand (frequent zero periods and occasional spikes) structurally inflates MAPE. In such cases, consider using tailored models like Croston or Teunter-Syntetos-Babai (TSB). It may also help to shift the time unit from weekly to monthly to reduce volatility.
Outliers and Seasonality
Outliers (e.g., promos, stockouts, launches) can distort MAPE if not addressed properly. Apply outlier detection and adjust the series to limit their impact. Similarly, incorporating known seasonal patterns and events into your model improves forecast reliability.
Advanced Models and Collaborative Forecasting
More sophisticated techniques (multiple regression, machine learning, neural networks) can reduce MAPE when backed by historical data and relevant variables. But technology alone isn’t enough: combining statistical models with expert judgement (collaborative forecasting) often yields the best results.
MAPE and Its Impact on Decision-Making: Safety Stock, Procurement and Production
A high MAPE doesn’t just mean poor accuracy, it directly affects your supply chain. Greater forecast error requires higher safety stocks to cushion uncertainty, increasing inventory costs.
In procurement, unreliable forecasts lead to erratic ordering, shortages, and rush charges. In production, poor visibility causes frequent rescheduling and inefficient line usage. Lowering your MAPE improves overall planning and helps optimise inventory, capital, and service levels.
Beyond MAPE: Measure Well to Plan Better
MAPE is a valid forecast performance indicator but should never be used in isolation. Combine it with KPIs like bias, stock cover, or forecast reliability by segment for a fuller picture.
In short: accurate measurement is the foundation of effective planning. And effective planning is not just about reducing errors, but understanding their cause, impact, and how to act. In increasingly volatile environments, having a robust forecasting system aligned with your business needs is a real competitive advantage.
At Imperia, we help companies improve their planning, streamline processes, and boost supply chain efficiency. Our advanced SCM software turns data into actionable insights. Want to see how it works? Book a free consultation with one of our experts. We’d love to help.
MAPE (Mean Absolute Percentage Error) is a metric used to measure forecast accuracy by comparing forecasted demand with actual demand over a specific period.
MAPE is calculated by averaging the absolute percentage difference between forecasted values and actual demand across all periods, then expressing the result as a percentage.
There is no universal “good” MAPE value. Acceptable levels depend on the industry, demand variability and product characteristics, but lower values generally indicate higher forecast accuracy.
MAPE can be misleading when actual demand values are very low or close to zero, as small absolute errors can result in very large percentage errors.
MAPE expresses forecast error as a percentage, making it easy to interpret. MAE and RMSE use absolute values and are often more reliable when demand includes zeros or strong fluctuations.
Related articles
 Demand Forecasting
Predictable and unpredictable demand: when to use forecasts and when to use buffers
Predictable and unpredictable demand should not be managed in the same way. One of the most common mistakes i…
 Demand Forecasting
Demand forecasting bias: how to spot BIAS in your forecast
Demand forecasting bias is one of the most dangerous planning errors because it doesn’t always show up as an…
 Demand Forecasting
Advanced Promotional Demand Management: Practical Techniques to Forecast Peaks and Avoid Stockouts
Promotional demand is one of the biggest challenges for any organisation running intensive commercial campaig…
 Demand Forecasting
Managing Demand Variability: Advanced Techniques That Actually Work
Demand variability is one of the factors that most affects forecast accuracy in any supply chain. When sales…
 Demand Forecasting
Collaborative Forecasting: When Sales and Operations Speak the Same Language
In many companies, demand forecasting is still an isolated, disconnected and often unreliable process. Sales…
 Demand Forecasting
Forecast accuracy: how to connect demand forecasting with business outcomes
Forecast accuracy is one of the most quoted indicators in demand planning and also one of the most misunderst…
Subscribe to our newsletter and transform your management!
Receive updates and valuable resources that will help you optimise your purchasing and procurement process.