MAPE and Supply Chain Forecasting: How to Measure and Enhance Accuracy
- Updated
- March 24, 2026
- Reading time
- 6 min read

MAPE (Mean Absolute Percentage Error) is one of the most commonly used metrics in demand planning. It measures how far a forecast deviates, on average, from actual demand, helping teams evaluate forecast accuracy across product lines, channels, or regions.
In this article, we’ll break down what MAPE is, how it’s calculated, where its limitations lie, and how to reduce it. It’s a hands-on guide to applying this metric effectively and making better-informed decisions in sourcing, supply, and production, because solid measurement is the first step to smarter planning.
What Is MAPE and How Is It Used in Demand Planning?
MAPE calculates the average percentage difference between forecasted and actual demand. In other words, it tells you how far off your forecast is, on average, from reality. One of its main advantages is how easy it is to interpret: a MAPE of 15% means the forecast is off by 15% on average.
It’s widely used in Sales & Operations Planning (S&OP), as well as in procurement, supply, and production planning. Because MAPE is expressed as a percentage, it allows for consistent performance comparisons across product families, sales channels, and regions. In industries like CPG, pharmaceuticals, manufacturing, and retail, it’s a go-to indicator for demand planners.
How Is MAPE Calculated? Formula and Real-World Example
The formula used to calculate MAPE is:

Where:
• D = actual demand.
• F = forecast.
• n = number of periods or items.
Example: How to Calculate MAPE
Let’s say forecasted sales for three weeks were 100, 150, and 200 units. Actual sales were 110, 140, and 180 units. MAPE would be calculated as:
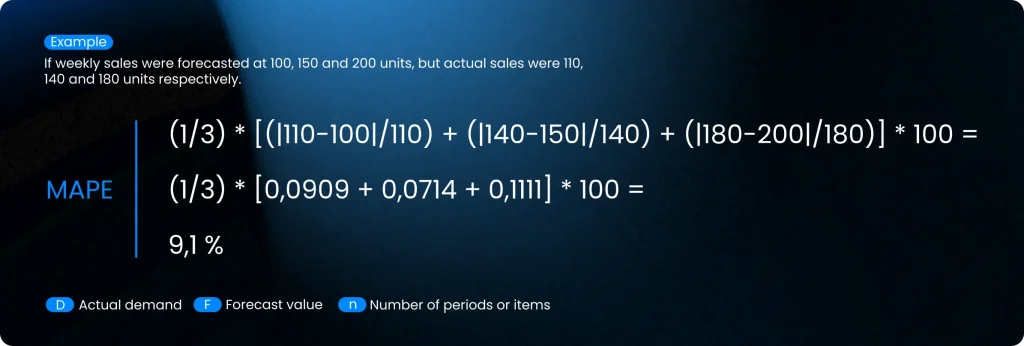
This means the forecast is off by 9.1% on average.
What’s Considered a “Good” MAPE? Industry Benchmarks
There’s no one-size-fits-all answer when it comes to acceptable MAPE. It depends on your business model, demand variability, and forecasting maturity. That said, here are some rough benchmarks:
- CPG (Consumer Packaged Goods): 15%–25% is generally acceptable.
- Manufacturing: typically falls between 20%–40%.
- Pharmaceuticals: 10%–20% in stable demand environments.
- Apparel/Retail: often exceeds 30% due to seasonality and short product lifecycles.
A MAPE below 10% is usually considered excellent, but is only achievable in highly predictable settings. What matters most is tracking its trend over time, identifying significant deviations, and analyzing the root causes.
MAPE Limitations: Where This Metric Can Mislead You
While MAPE is widely used, it isn’t perfect. One of its biggest issues is how it reacts to low-demand items. When actual demand is close to zero, the percentage error skyrockets, even if the actual quantity gap is small, skewing the average.
Another flaw: MAPE penalizes both over-forecasting and under-forecasting equally, even though their operational impact is often very different. Overstocking a low-margin item might be tolerable, but understocking a high-value product can have serious consequences.
Also, MAPE doesn’t show which SKUs are responsible for most of the error. Two product portfolios could have the same MAPE, one with evenly distributed error, and another with a few SKUs creating most of the distortion.
How to Reduce MAPE in Complex Supply Chains
Lowering MAPE is about more than choosing the right forecasting model. Demand type, data anomalies, and cross-functional input all play a part. Here are three proven strategies to improve forecast accuracy in volatile or complex environments:
Intermittent Demand
If your product has intermittent demand (frequent zero periods with occasional spikes), MAPE tends to inflate by default. Try switching to models designed for this pattern, such as Croston or TSB (Teunter-Syntetos-Babai). It may also help to aggregate the time series, switching from weekly to monthly intervals to reduce noise.
Outliers and Seasonality
Promotions, stockouts, or product launches often show up as outliers in the data. If you don’t adjust for them, they can skew your MAPE significantly. Use outlier detection and series adjustment to control their impact. Also, bake in seasonality and known events to make forecasts more accurate and trustworthy.
Advanced Models + Human Insight
Advanced forecasting techniques (like multiple regression, machine learning, or neural networks) can drive down MAPE when supported by relevant historical data. But don’t rely on tech alone. Collaborative forecasting, which combines statistical models with expert insight, consistently outperforms either approach on its own.
Why MAPE Matters: Impact on Safety Stock, Sourcing, and Production
A high MAPE doesn’t just signal a weak forecast, it directly impacts your entire supply chain.
When forecast accuracy is low, you need more safety stock to cover the uncertainty. This raises inventory carrying costs. On the sourcing side, poor forecasts lead to erratic ordering, higher expediting costs, and greater risk of stockouts.
In production, it means constant rescheduling, inefficient batch sizes, and wasted line time. Improving MAPE brings direct benefits: tighter inventory management, smarter procurement, and smoother manufacturing execution.
MAPE Is a Starting Point, Not the Whole Picture
MAPE is a useful metric, but it shouldn’t be your only one. Combine it with other KPIs like forecast bias, inventory coverage, or forecast reliability by segment to get the full picture.
In short: better measurement leads to better planning. But good planning goes beyond reducing error, it’s about understanding where those errors come from, how they affect your operations, and what to do about them. In today’s unpredictable environment, having a robust, business-aligned forecasting process is a serious competitive edge.
At Imperia, we help businesses improve planning accuracy, streamline operations, and boost supply chain performance. Our advanced SCM platform turns your data into real-time, actionable insight.
Want to see how it works? Schedule a free consultation with one of our experts, we’d love to help.
MAPE (Mean Absolute Percentage Error) is a metric used to measure forecast accuracy. It calculates the average percentage difference between forecasted values and actual demand over a specific period, making it easy to interpret and compare across products or timeframes.
MAPE is calculated by taking the average of the absolute percentage error between actual demand and the forecast for each period. The formula divides the absolute error by the actual value and expresses the result as a percentage.
A “good” MAPE depends on the context. In many supply chain environments, a MAPE below 10–20% is considered acceptable, but this varies depending on demand volatility, product lifecycle stage and data quality.
MAPE can be misleading when actual demand values are very low or close to zero. In these cases, small absolute errors can result in very high percentage errors, which may distort the perceived forecast accuracy.
Unlike MAE or RMSE, MAPE expresses forecast error as a percentage, which makes it easier to interpret. However, MAE and RMSE are often more reliable for low-volume or intermittent demand, where MAPE may exaggerate errors.
Related articles
 Demand Planning
Predictable and Unpredictable Demand: When to Use Forecasts and When to Use Buffers
Predictable and unpredictable demand should not be managed the same way. One of the most common planning mist…
 Demand Planning
Demand Forecasting Bias: How to Detect BIAS in Your Forecast
Demand forecasting bias is one of the most dangerous planning errors because it does not always appear as an…
 Demand Planning
Advanced Promotional Demand Management: Practical Techniques to Forecast Peaks and Prevent Stockouts
Promotional demand is one of the toughest challenges for organizations running intensive commercial campaigns…
 Demand Planning
Managing Demand Variability: Advanced Techniques That Actually Work
Demand variability is one of the biggest drivers of forecast inaccuracy across any supply chain. When sales b…
 Demand Planning
Collaborative Forecasting: When Sales and Operations Are on the Same Page
In many organizations, demand forecasting remains a siloed, one-way process that often falls short. Sales tea…
 Demand Planning
Impact of Seasonality on Demand
Seasonality is a recurring phenomenon that affects many industries, significantly influencing the demand for…
Subscribe to our newsletter and transform your management!
Receive updates and valuable resources that will help you optimize your purchasing and procurement process.