Downloadable
XYZ Classification in the Supply Chain
In supply chain management, understanding the variability of demand for items is crucial for making informed and efficient decisions. This is where XYZ classification becomes relevant.

In supply chain management, understanding the variability of demand for items is crucial for making informed and efficient decisions. This is where XYZ classification becomes relevant.
In this article, we will examine how you can use XYZ classification to improve the efficiency of your supply chain. Additionally, we will provide you with our Excel template (which you can download here) specifically designed to facilitate the implementation of this type of segmentation and indicate the appropriate strategies for each category.
What is XYZ Classification?
XYZ classification is a classification technique that focuses on the variability of product demand and allows us to identify items with stable, moderately variable, and unpredictable behaviors.
Understanding XYZ segmentation in depth will allow us to apply appropriate strategies for each category, thus optimizing our company's operations, improving its efficiency, and effectively responding to the challenges posed by demand variability for each type of product.
How is XYZ Segmentation Calculated?
To remind you, if we have n data points, the mean, standard deviation, and coefficient of variation are calculated as follows:

Categories in XYZ Classification
When performing XYZ classification, we will encounter three different categories: Category X, Category Y, and Category Z. Below, we indicate how to use the data to categorize each item and what each categorization implies:
- Class X: Items with stable and predictable demand, with a CV of 0.5 or less. These items are characterized by consistent demand behavior.
- Class Y: Items with moderately variable demand, with a CV greater than 0.5 and less than or equal to 1.5. These items exhibit some variability in demand over time.
- Class Z: Items with highly variable and unpredictable demand, with a CV greater than 1.5. These items have very unstable demand and may be difficult to predict.
The level of temporal aggregation we choose when calculating our XYZ classification is very important. For example, if we select an annual level, it is more likely that many references will fall into Category X. However, if we compute our data daily, its CV will increase, and the number of items classified in Category X will be lower.
As a general rule, the higher the level of temporal aggregation, the lower the variability, which implies a lower CV and more references in Class X. Therefore, when selecting the level of temporal aggregation, we must consider the planning horizon we manage, as well as choose a grouping that allows us to discern products from our portfolio. In our template, we propose a monthly level, as it is the most common in companies' planning horizons, since we will use this classification for inventory management and production and distribution policies.
Recommended Strategies for Products in Each XYZ Category
Once we have completed the XYZ segmentation and know which items belong to each category, the next step is to establish a different strategy for each:
Category X:
- Precise Planning and Inventory Management: Since products in this category have stable demand, long-term precise planning is possible. We can base our forecasts on demand forecasting tools, using historical sales data to produce an accurate forecast. Additionally, you can implement strategies such as scheduled replenishment to ensure the constant availability of these products.
- Supply Chain Optimization: With stable demand, it is possible to further optimize your supply chain. You can look for ways to reduce costs, improve efficiency, and streamline production and distribution processes. Consider establishing solid agreements with reliable suppliers and improving coordination across all stages of the supply chain.
- Focus on Product Quality and Customer Satisfaction: With stable demand, it is crucial to maintain product quality and ensure long-term customer satisfaction. Continuously monitor quality standards, improve quality control processes, and maintain open communication with customers to understand their needs and expectations.
Category Y:
- Flexibility in Production and Distribution: Products in this category require greater flexibility in production and distribution due to their variable demand. Implement strategies that allow you to quickly adjust production capacity and adapt distribution routes according to changes in demand. This will help you maintain appropriate inventory levels and minimize the risk of stockouts or excess inventory.
- Trend and Demand Pattern Analysis: To effectively manage demand variability, it is essential to regularly analyze trends and demand patterns in this category. Use data analysis tools and techniques to identify potential influencing factors, such as seasonality, special events, or changes in customer preferences. This will allow you to anticipate fluctuations and adjust your operations accordingly.
- Collaboration with Suppliers and Business Partners: Given the variable nature of demand in this category, it is important to establish solid collaboration with suppliers and business partners. Share relevant information about demand forecasts, promotional events, and changes in market requirements. This collaboration will facilitate joint responsiveness and help manage demand variability effectively.
Category Z:
- Risk and Contingency Management: Products in this category require careful risk and contingency management. Implement contingency plans to address situations of high variability or unpredictable demand. Consider having alternative suppliers, flexible production capacity, and additional storage options to handle unexpected demand spikes. Additionally, establish indicators and monitoring systems to detect early signals of demand changes and act promptly. Maintain open and fluid communication with your suppliers and customers to anticipate potential challenges and find joint solutions.
- Focus on Demand Management: It is essential to focus on proactive demand management. Maintain close communication with your customers and closely monitor market trends to anticipate changes in demand and adjust your planning and production accordingly.
- Innovation and Adaptability: It is important to foster innovation and adaptability in your company. Continuously seek new ways to meet the changing needs of your customers and respond quickly to market trends. Stay up-to-date with the latest technologies and practices in supply chain management, and be proactive in implementing necessary improvements and changes to maintain your competitive edge.
In summary, for items categorized as Class X, precise planning and production efficiency should be prioritized. For items categorized as Class Y, flexible planning and agile supply chain management strategies should be applied. Finally, for items categorized as Class Z, extremely flexible planning and appropriate risk and contingency management are required.
Limitations of XYZ Classification
One issue with segmenting our portfolio using only XYZ classification is that the variability in product sales can be caused by various factors such as seasonality, trends, cycles, and randomness. Let’s look at a couple of examples to understand this better.
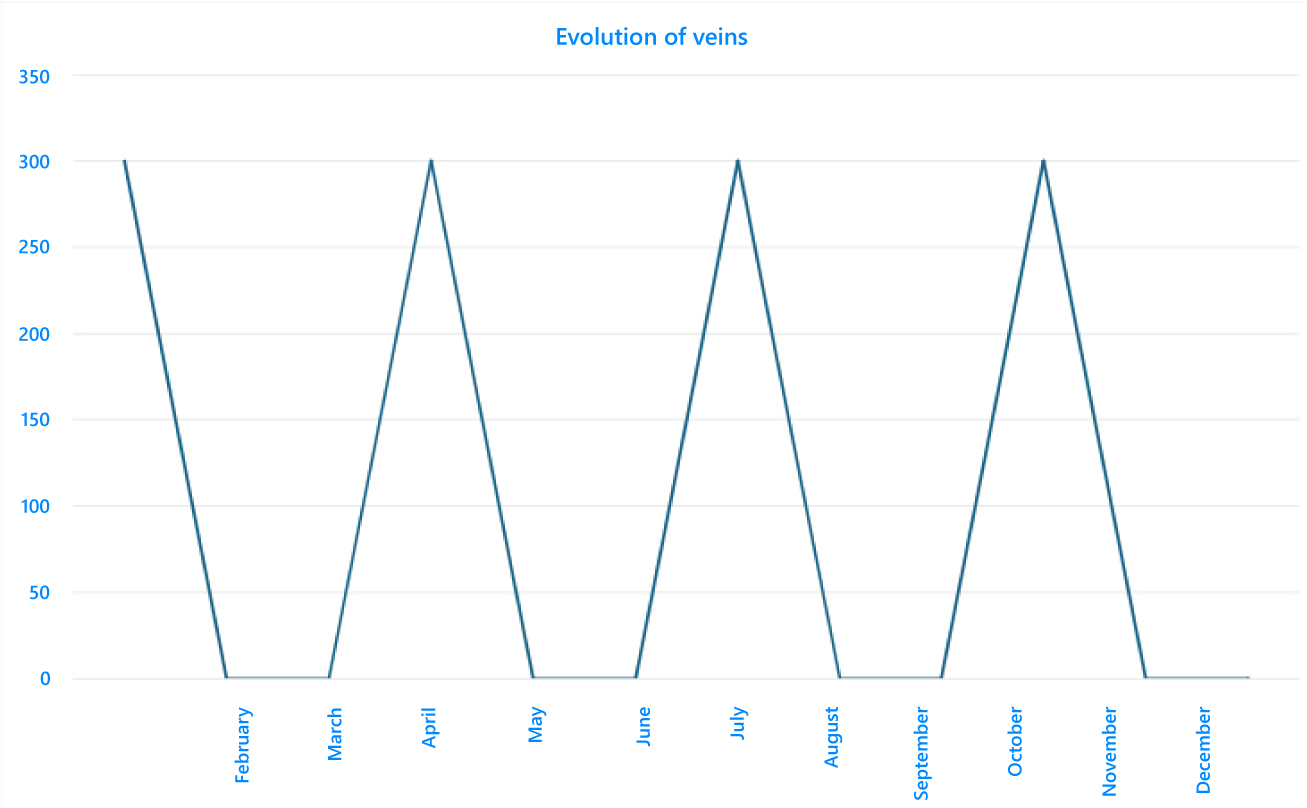
Suppose we have a customer who buys a product with a monthly demand of 100 units, while we cannot fulfill an order of fewer than 300 units. As a result, if we look at our sales history, it will appear as follows.

If we analyze this reference, its CV is 1.41, which would fall into category Y, while for us it is very predictable, so we would prefer it to be in category X.
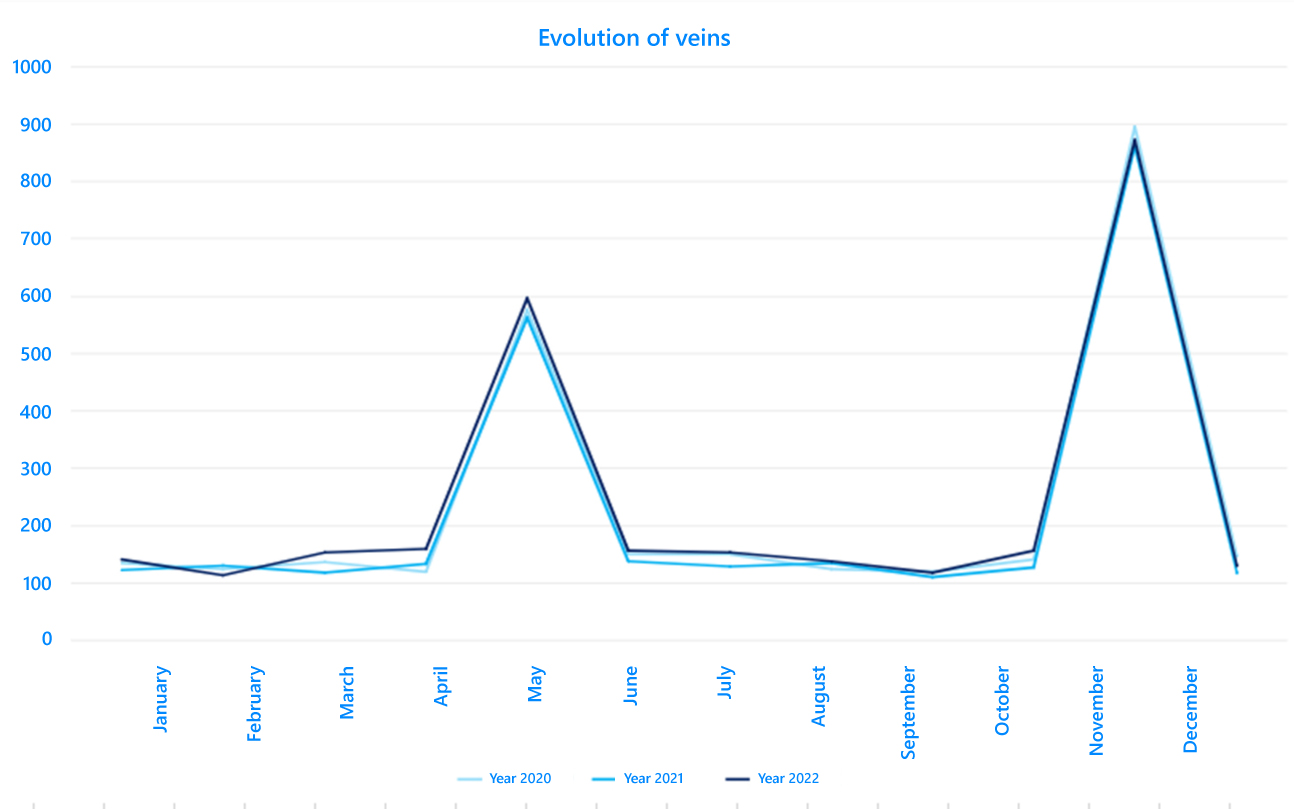
Consider another example, a flower shop with sales peaks on All Saints' Day in November and May. If we look at its history, we might say it is quite predictable.
However, applying XYZ gives us a CV of 0.97, which would classify it as Y.

How Do We Deal with This Issue?
In SCP, to address this issue, we perform a curve decomposition before applying the XYZ calculation, separating our historical data into trend and cycle components, seasonality, and randomness, and apply this test to these data components. Thus, for these two examples, we would obtain a classification of X for this reference. This changes the focus from variability to predictability, so X represents the most predictable references, and Z represents those with the most difficulty in forecasting, requiring precise measures.
How to Implement the XYZ Classification Excel Template?
In the Data Source tab, upload the sales data. Enter the product code and description if you are more familiar with your product names. Compute this data monthly for the last 13 months; if you do not have data for the last month, replace it with the forecast for that month.
In the XYZ Summary tab, you can filter and sort references by category, and you will be able to see the specific CV for each reference and the total sales.
In the XYZ Chart tab, you can adjust your XYZ parameters (though we recommend 0.5, 1.5, ∞) and view graphically the distribution of your business, the percentage relative to the total, and the number of references belonging to each category at a glance.
Advantages of Implementing the XYZ Classification Template
With our template, you can effectively implement XYZ Segmentation in your supply chain. You will gain the following benefits:
- Automated Classification: The template will perform the necessary calculations to classify your products into categories X, Y, and Z based on the coefficient of variation (CV) of demand. This will save you time and effort by avoiding manual classification.
- Clear Visualization: The template will visually present how your products are distributed in each XYZ category. This will allow you to quickly identify products with stable, moderately variable, or unpredictable demand, facilitating decision-making and resource allocation.
- Data-Driven Decision Making: With a clear classification and recommended strategies (developed below), you can make informed decisions regarding your products. You will be able to allocate resources more effectively, anticipate demand variability, and ensure a more efficient and profitable supply chain.
Remember that XYZ segmentation provides a solid foundation for understanding and managing variable demand in your supply chain. By applying the appropriate strategies to each category, you can optimize your operations, improve efficiency, and effectively respond to the challenges associated with demand variability for each type of product.
At Imperia, we are experts in optimizing your supply chain with our Supply Chain Planning software, making your company more efficient and sustainable. Don’t wait any longer and request a free demo with our experts!

Pablo Sánchez is a Forecasting and Modeler Specialist at Imperia SCM. A mathematics graduate, he is responsible for researching and creating statistical models to improve the efficiency of each client's supply chain.

Enter your email and download the content
In supply chain management, identifying key elements that require special attention can make the difference between success and failure.


