Free Forecast Accuracy dashboard in Excel to analyse the accuracy of your forecasts

Our free Forecast Accuracy dashboard in Excel lets you objectively assess the quality of your demand forecasts over the last six months. It is designed for supply chain, planning and operations teams that need to understand how reliable their forecasts are and where the main errors are concentrated.
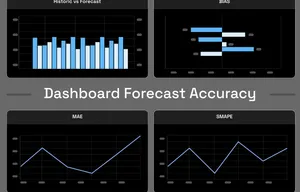
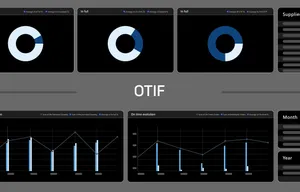
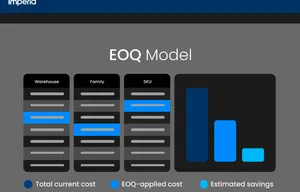
By comparing forecasts with actual demand, this template automatically calculates the key forecast accuracy KPIs: MAPE, MAE and BIAS. These indicators help you identify systematic deviations, recurring errors and potential bias in your forecasting models both at an aggregated level and by SKU, product family or warehouse.
Thanks to its practical, visual approach, the dashboard makes it easier to answer critical day-to-day questions: Are we overestimating or underestimating demand? Which products show the largest errors? Is forecast accuracy improving or getting worse over time?
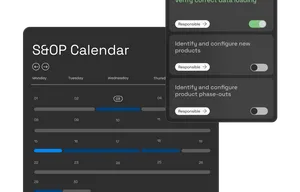
In addition, analysis by monthly, quarterly and six-month periods helps you spot trends, assess planning stability and prioritise improvement actions with a real impact on inventory, service levels and decision-making.
This template is especially useful if you want to:
- Measure the true reliability of your forecasting process.
- Align teams around objective metrics.
- Identify improvement opportunities before errors affect stock or service.
- Build a solid foundation to optimise your forecasting models.
A simple, useful tool based on real data to take the first step towards more accurate planning. Download it for free now and keep your forecasts under control.