OEE (Overall Equipment Effectiveness): Is Your Plant Truly Running at Its Best?
- Updated
- August 6, 2025
- Reading time
- 6 min read

When we talk about efficiency in manufacturing, people often focus on speed, throughput, or cost per unit. But true efficiency digs deeper. OEE (Overall Equipment Effectiveness) is one of the most reliable metrics for measuring how well your equipment is performing. Even more importantly, it plays a key role in improving planning decisions.
In this article, we’ll break down what OEE is, how to calculate it accurately, and how to leverage it in your Supply Chain Planning process to drive smarter outcomes.
What Is OEE and Why Should It Matter to Manufacturing Planners?
OEE (Overall Equipment Effectiveness) measures how effectively equipment, production lines, or entire plants are performing, using a combination of three key inputs: availability, performance, and quality. Originally developed through the TPM (Total Productive Maintenance) framework, it’s now a go-to benchmark for planners and operations teams alike.
Unlike metrics that only track output volume, OEE evaluates how much productive time is spent generating good units. It gives a fuller picture of equipment utilization and reliability.
The Three Elements of OEE: Availability, Performance, Quality
OEE = Availability × Performance × Quality.
Let’s break those down:
- Availability: The ratio of actual operating time vs. planned production time, accounting for downtime like breakdowns, changeovers, or unexpected stops.
- Performance: How the actual run rate compares to the ideal or design speed.
- Quality: The proportion of non-defective units produced vs. total output.
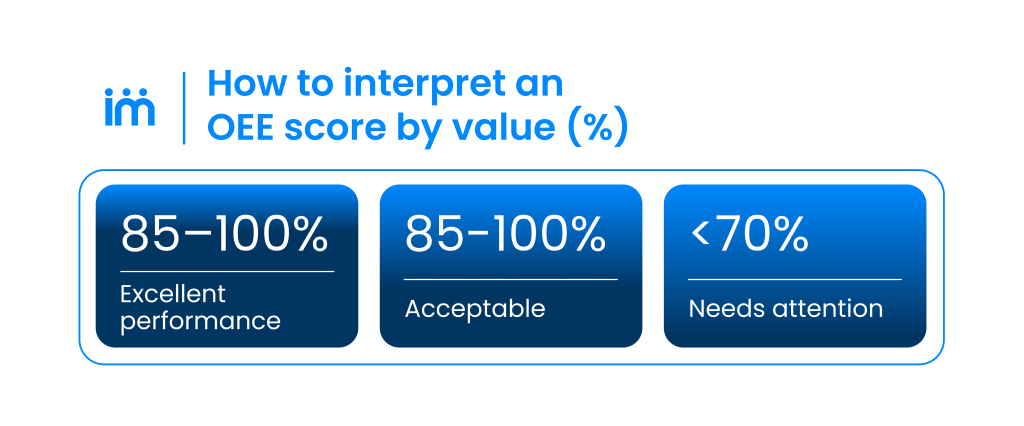
The resulting OEE score tells you how much of your potential capacity is being used productively.
OEE Outside of MES: Why It Still Matters
You don’t need a full-blown MES (Manufacturing Execution System) to benefit from OEE. In fact, for many manufacturers still undergoing digital transformation, OEE is a useful entry point. It helps compare theoretical capacity to actual throughput and improves the accuracy of production planning.
From a Supply Chain Planning (SCP) perspective, OEE provides the operational reality behind the numbers.
What Does a Low OEE Actually Tell You?
A poor OEE score isn’t just a red flag for equipment efficiency, it’s a signal that planning assumptions might be flawed. If your Master Production Schedule (MPS) relies on idealized capacity that doesn’t match reality, you’re setting yourself up for delays, cost spikes, and service issues.
Planning Impact: Late Deliveries, Higher Costs, Unhappy Customers
If you overestimate capacity, you’ll build schedules you can’t execute. That means missed delivery windows, extra shifts, last-minute orders, and reliance on emergency outsourcing, all of which eat into margin and service levels.
Unseen Bottlenecks Disrupt Decision-Making
Without OEE, a failing asset might go unnoticed, creating bottlenecks upstream. These issues break the link between planning and execution. When data is missing, planners fly blind.
What Decisions Can You Make with Better OEE Visibility?
OEE (Overall Equipment Effectiveness) isn’t just a report metric. It enables actionable decisions:
Shifting Resources and Smoothing Workloads
If one line is running at 50% OEE and another at 85%, you may be able to reassign products, balance workloads, and reduce overtime, all while boosting throughput.
Justifying Upgrades or Subcontracting
Low OEE on a critical machine may mean it’s time to invest in new equipment or outsource part of the production process to keep orders flowing.
Prioritizing Orders Based on Line Performance
During busy periods, knowing which lines are the fastest and most reliable allows you to make informed calls on what to run, and when.
How OEE Connects to Advanced Planning Tools
When integrated into SCP platforms, OEE (Overall Equipment Effectiveness) adds real operational insight to long-term planning. It brings the shop floor into alignment with strategic decisions.
Matching Capacity Models to Real Output
Let’s say your line is rated for 1,000 units per hour, but with an OEE of 60%, it’s only delivering 600. Planning with inflated figures leads to missed targets.
Reacting in Real Time
If a line’s OEE starts trending down, planners can reassign orders, add shifts, or adjust priorities before service levels are affected.
Early Warning Signals for Risks
With OEE data, planners can detect signs of overload or inefficiency early, opening up cross-functional conversations between production, procurement, and logistics.
How to Calculate OEE (Overall Equipment Effectiveness) Accurately
Even without automation, you can calculate OEE using basic data from the floor. Here’s how it works.
The Standard OEE Formula
Availability = Run Time / Planned Time
Performance = Actual Output / (Run Time × Ideal Speed)
Quality = Good Units / Total Units
OEE = Availability × Performance × Quality
Example of OEE Calculation
Let’s say:
- You planned an 8-hour shift.
- The line was down for 1 hour.
- You produced 4,000 units at 500 units/hour.
- Ideal speed is 600 units/hour.
- 200 units were defective.
Availability = 7h / 8h = 0.875
Performance = 4,000 / (7 × 600) = 0.952
Quality = 3,800 / 4,000 = 0.95
OEE = 0.875 × 0.952 × 0.95 = 79.1%
Where to Pull the Data
You can pull OEE data from multiple sources, such as manual operator logs, automated SCADA or PLC systems, quality control reports, ERP, MRP, and planning platforms. Regardless of the source, what matters most is consistency and reliability.

Improving OEE in Factories with Limited Tech
You don’t need a full smart factory to boost OEE. Simple practices go a long way.
Focus on the Basics: Micro-Stops, Setup Time, 5S
To improve efficiency, it’s important to eliminate unnecessary movement and idle time, reduce setup durations with SMED, and make sure teams are properly trained to follow standardized procedures. It’s also key to respond quickly to micro-stops and unexpected downtime to keep operations running smoothly.
Get the Team Involved
Improving OEE doesn’t require big investments. You can start by training all team members on what OEE really means and why it matters. A short daily stand-up, even just ten minutes, helps surface issues early and keep everyone aligned. Visual boards placed in key areas make performance visible, promote accountability, and encourage team engagement.
Special Cases: Interpreting OEE in Manual or Custom Workflows
In highly variable or manual production environments, standard OEE may need adjusting.
Challenges in Low-Volume, High-Mix Workflows
When every order is different, it’s hard to define an «ideal» run speed. Human variation and product customization complicate the math.
Adapted Approaches
If quality is harder to measure consistently, it’s useful to focus on availability and performance instead. Setting benchmarks by product family provides a more realistic view of expectations, while complementary metrics like throughput and hourly productivity help validate and refine your analysis.
OEE (Overall Equipment Effectiveness) as a Strategic Planning Tool
OEE (Overall Equipment Effectiveness) is more than a metric. It connects what’s happening on the floor with what you’re trying to achieve as a business.
It aligns your resources, exposes risk, and helps you make better decisions around scheduling, capacity, and resource planning.
Whether you’re running a fully digitized plant or still working toward automation, tracking OEE gives you an edge. At Imperia, we help companies use this data to improve planning, reduce waste, and increase overall efficiency.
Want to see how it works? Request a free consultation with our team.
Related articles
 Production and Capacity
Production Changeover Cost: How to Measure It and Use It to Plan Better
The production changeover cost is one of the most important variables for understanding why a seemingly sound…
 Production and Capacity
Master Production Schedule Stability: How to Reduce Replanning and Its Impact on Service and Cost
Master production schedule stability is one of the foundations of effective production planning, especially i…
 Procurement and SuppliersProduction and Capacity
Product Mix Optimization: How to Decide What to Make and Buy to Maximize Profitability
Product mix optimization is one of the hardest decisions in supply chain management and one of the most conse…
 Production and Capacity
Rough Cut Capacity Planning (RCCP) in Action: What It Means, How to Use It, and What to Watch Out For
When it comes to plant capacity, planning isn’t just about tweaking schedules or running extra shifts. If the…
 Production and Capacity
Aggregate Planning: A Tactical Approach to Staying Ahead in the Supply Chain
In supply chain management, focusing only on short-term execution often leads to reactive decisions, producti…
 Production and Capacity
Finite Capacity vs. Infinite Capacity: Which Approach Fits Your Production Strategy?
Planning production without factoring in real-world resource limits is one of the main causes of delays, bott…
Subscribe to our newsletter and transform your management!
Receive updates and valuable resources that will help you optimize your purchasing and procurement process.