OTIF (On Time In Full): How to Measure and Improve Supply Chain Service Levels
- Updated
- January 28, 2026
- Reading time
- 9 min read
 as a key service level indicator.")
OTIF (On Time In Full) is one of the most widely used metrics for measuring service levels in the supply chain and also one of the most frequently misunderstood. Many organizations track it as a standalone percentage without digging into what actually drives that number or how it connects to inventory, planning, cost and customer experience. The result is often frustration: a seemingly strong OTIF score alongside recurring operational issues.
In this article, we take a deeper look at what OTIF really represents, how to calculate it correctly and, most importantly, how to use it as a decision-making tool. We’ll explore why a good OTIF score does not always equal efficiency, how it links to forecasting, inventory and supplier performance and which approach helps improve it sustainably without constant firefighting.
What OTIF Is and Why It’s One of the Most Critical Supply Chain KPIs
OTIF has become a benchmark KPI because it captures, in a single measure, the core promise of any supply chain: delivering the right product, at the agreed time, in the committed quantity. However, its apparent simplicity hides a level of complexity that needs to be understood to avoid misleading conclusions.
OTIF (On Time In Full) Definition
OTIF (On Time In Full) measures the percentage of orders delivered both on time and in full, according to the conditions agreed with the customer. For an order to qualify as OTIF, it must meet both criteria simultaneously: timeliness and completeness. If either condition fails, the order is considered non-compliant.
This binary logic makes OTIF a strict indicator but also one that closely reflects how customers actually perceive service. From their perspective, a late delivery or a partial shipment is simply a service failure.
What OTIF Measures and What It Does Not
OTIF measures the final service outcome, not the process that leads to it. It tells you whether a commitment was met, but it does not explain why it failed. It does not differentiate between forecast error, supplier delays, inventory shortages or logistics issues.
That’s why, while OTIF is an excellent compliance metric, it should never be used in isolation. Without complementary indicators, OTIF highlights the symptom but offers no guidance on how to fix the underlying problem.
How to Calculate OTIF Step by Step
Calculating OTIF consistently is essential if the metric is going to be reliable and comparable over time. Small differences in interpretation can significantly distort results.
OTIF Formula Explained Simply
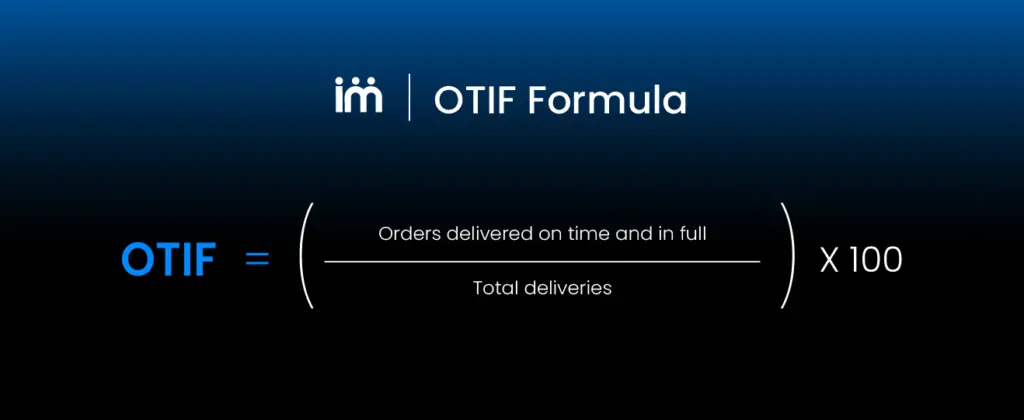
The OTIF formula is straightforward:
OTIF (%) = (Orders delivered on time and in full / Total orders delivered) × 100
Only orders that meet both conditions count as OTIF. There are no averages or partial scores: an order either complies or it doesn’t.
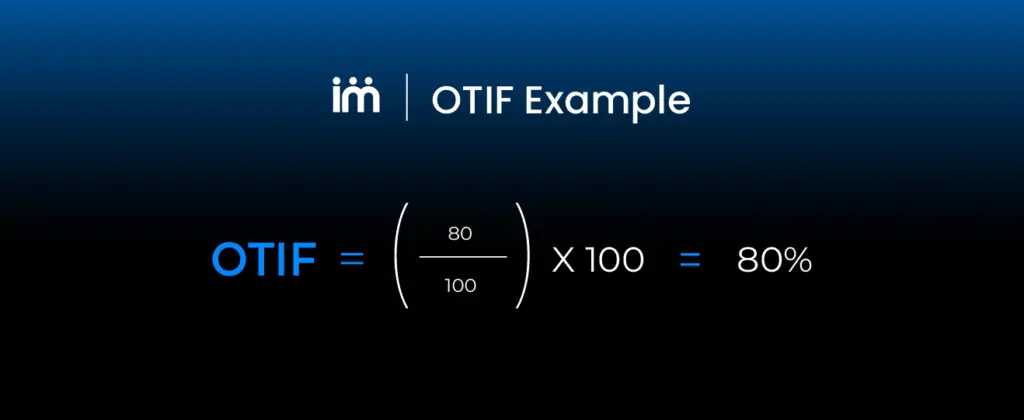
Practical Example of an OTIF Calculation
If 100 orders are delivered during a given period and only 80 arrive on the agreed date with the full quantity, OTIF equals 80%. Even if some of the remaining 20 orders were only slightly late or short, from an OTIF perspective they are still counted as failures.
This example helps explain why OTIF is often lower than other, less demanding service indicators.
Common Mistakes When Calculating OTIF
One of the most common mistakes is failing to clearly define what “on time” means. Is there an allowed tolerance in hours or days? Another frequent issue is mishandling partial deliveries or split orders shipped in multiple batches.
Without clear, consistent rules, OTIF quickly loses value as a management metric and becomes a source of internal debate rather than insight.
Why a Good OTIF Score Doesn’t Always Mean an Efficient Supply Chain
A high OTIF score is desirable, but on its own it does not guarantee an efficient operation. In fact, it can sometimes mask deep inefficiencies.
The Risk of Improving OTIF Without Considering Inventory and Cost
Some organizations boost OTIF by increasing safety stock or relying on expedited transportation. Service levels improve, but costs rise sharply. The metric looks healthy while margins quietly deteriorate.
Optimizing OTIF without analyzing inventory levels and cost to serve often leads to defensive decisions that are not sustainable over time.
When OTIF Depends on Expediting and Excess Inventory
Urgent shipments, last-minute production changes or emergency purchases are signs of weak planning. While these actions may protect service in the short term, they create operational stress and erode profitability.
In these situations, OTIF reflects the team’s effort rather than the strength of the system.
High OTIF and Low Margins: A Common Combination
It’s not unusual to see companies with strong OTIF performance and weak profitability. When service metrics are disconnected from economic impact, decisions tend to prioritize compliance over value creation.
This is where OTIF must evolve from a purely operational KPI into a decision-oriented metric.
OTIF and Its Direct Link to Demand, Inventory and Planning
OTIF is not created in the warehouse or during transportation. It is the final outcome of decisions made much earlier in demand planning, inventory policy design and capacity management. When these decisions are misaligned, service levels become unstable regardless of execution effort.
Understanding OTIF as the result of the planning system makes it possible to act on the right levers and improve it sustainably, without relying on costly, reactive fixes.
How Forecast Accuracy Influences OTIF
Forecast accuracy is one of the strongest drivers of OTIF. Unreliable forecasts create systematic mismatches between expected and actual demand, leading to stockouts or excess inventory depending on the direction of the error.
Even with flawless logistics execution, poor forecasting limits the ability to deliver on time and in full. Improving forecast accuracy and stability is therefore one of the most effective ways to raise OTIF structurally.
OTIF’s Impact on Stockouts, Excess Inventory and Tied-Up Capital
Low OTIF often results in stockouts, lost sales and customer dissatisfaction. On the other hand, achieving high OTIF through overstock carries hidden costs: higher working capital, increased obsolescence risk and margin pressure.
Only by analyzing OTIF alongside inventory metrics such as turns and coverage can organizations strike the right balance between service and financial efficiency.
OTIF as an Outcome, Not a Starting Point
OTIF should not be the first KPI teams try to fix. It should be the outcome of a well-designed planning process. When treated as an isolated target, teams end up addressing symptoms instead of root causes.
More mature organizations use OTIF as a validation metric: if planning works, OTIF improves. If not, attention shifts back to demand, inventory and capacity planning, where service levels are truly built.
OTIF for Suppliers: Identifying and Managing Critical Risks
A significant portion of OTIF performance depends on suppliers. Measuring and analyzing it correctly is essential for proactive supplier management.
Measuring OTIF by Supplier, Not Just in Aggregate
An overall OTIF figure can hide suppliers with inconsistent or poor performance. Analyzing OTIF by supplier helps identify risk concentrations and prioritize corrective actions.
This approach is especially valuable in environments with multiple suppliers and variable lead times.
Segmenting Suppliers by Risk and Operational Impact
Not all OTIF failures have the same impact. Combining OTIF with volume, criticality and available alternatives allows suppliers to be segmented and managed with differentiated strategies.
As a result, supplier management becomes more focused and less reactive.
OTIF as a Tool for Procurement and Negotiation Decisions
OTIF provides objective evidence to support contract renegotiations, supplier development initiatives or changes in procurement strategy.
To support this analysis, visibility is key. That’s why we’ve created a free OTIF dashboard in Excel that helps you analyze supplier performance, identify patterns and make decisions based on real data. Download it and take the first step toward a more professional approach to service management.
OTIF as an Executive KPI: From Operations to Strategy
When properly integrated, OTIF moves beyond operations and becomes part of the executive dashboard. It’s not just about whether commitments are met, but about what is being promised, at what cost and with what level of risk.
At this level, OTIF acts as a reliability indicator for customers, partners and the market.
Linking OTIF to Service, Cost and Customer Experience
OTIF doesn’t just measure deliveries. It measures trust. A failure affects customer perception, satisfaction and the likelihood of repeat business or penalties.
From an executive standpoint, OTIF should be reviewed alongside service levels, cost to serve and margin to understand real trade-offs and value creation.
OTIF Within an S&OP or S&OE Process
In mature S&OP or S&OE processes, OTIF serves as an early warning signal of imbalances between demand, capacity and inventory. It is discussed proactively when evaluating future scenarios, not after problems occur.
This integration helps anticipate risks such as demand spikes, supplier reliability issues or unrealistic production plans.
From Measuring Deliveries to Governing Commitments
When used correctly, OTIF shifts the organization from measuring execution to governing commitments. This includes defining realistic lead times, deciding which orders to accept and managing flexibility without destabilizing the system.
In this way, OTIF becomes a discipline mechanism that protects both service and profitability.
How to Improve OTIF Sustainably (Without Constant Firefighting)
Sustainable OTIF improvement requires changing how service levels are understood and managed. It’s not about reacting faster when problems arise, but about structurally reducing the situations that cause them.
When OTIF is addressed through planning rather than urgency, it becomes a natural outcome of a stable supply chain.
Fix Root Causes, Not Symptoms
Most OTIF improvement efforts fail because they focus on visible symptoms: isolated delays or specific shortages. In reality, these issues often stem from recurring patterns linked to forecasting errors, weak inventory policies or unmanaged capacity constraints.
Addressing root causes reduces repeat failures and frees teams from constant expediting.
Align Demand, Procurement, Inventory and Logistics
OTIF is the result of connected decisions across the supply chain. When functions operate with different targets, data and horizons, service failures are almost inevitable.
Alignment across demand planning, procurement, inventory and logistics reduces internal friction and improves service without systematic cost increases.
Moving From Reactive Management to Proactive Planning
The difference between unstable and reliable OTIF often comes down to anticipation. Reactive organizations respond after issues appear. Mature ones detect risk early.
Proactive planning supported by realistic forecasts and scenarios protects service levels without inflating inventory or relying on emergency actions.
OTIF Is Not a Logistics Metric, It’s a Trust Metric
OTIF reflects the true health of the supply chain and an organization’s ability to deliver on its promises. Measuring it correctly is important, but using it wisely matters even more. When connected to demand, inventory and business decisions, OTIF becomes a powerful improvement lever.
At Imperia, we help organizations integrate OTIF into a connected planning model where demand, operations and finance share a forward-looking view through our Supply Chain Planning software. This approach improves service levels sustainably without sacrificing margin or efficiency. If you’d like to see how, request a free advisory session with our experts.
Related articles
-
 Procurement and Suppliers
Commercial Purchasing Terms: How to Stop Them From Breaking Your Plan
Commercial purchasing terms are not just an administrative detail. In many companies, they are one of the mai…
-
 Procurement and Suppliers
Constraint-Based Procurement Planning: MOQ, Supplier Capacity and Loading Windows
Constraint-based procurement planning has become essential for most industrial organizations. Purchasing deci…
-
 Procurement and Suppliers
Supplier Risk in the Supply Chain: How to Get Ahead of It With Data and AI
Supplier risk has become one of the biggest drivers of disruption in modern supply chains. As networks global…
-
 Procurement and Suppliers Production and Capacity
Product Mix Optimization: How to Decide What to Make and Buy to Maximize Profitability
Product mix optimization is one of the hardest decisions in supply chain management and one of the most conse…
-
 Procurement and Suppliers
Best Practices for Supply Chain Procurement Control
Supply chain procurement management is a critical component that can determine an organization’s succes…
-
 Procurement and Suppliers Technology and Digitalization
Reducing operational costs with efficient procurement software
Managing operational costs is a constant challenge for businesses in a competitive business environment. Effi…
Subscribe to our newsletter and transform your management!
Receive updates and valuable resources that will help you optimize your purchasing and procurement process.